Having some basic knowledge of indicators under your belt is a great start to technical analysis, but there is another very important skill that you need to learn in order to become an analysis whizz-kid! That skill is learning how to recognize and read candle patterns.
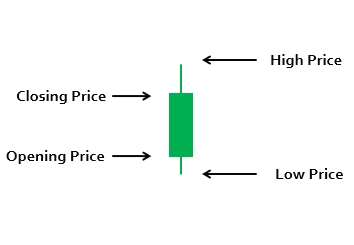
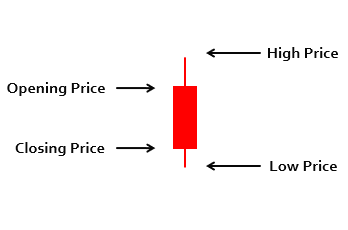
As you may or may not know, most traders use candlestick charts in their trading. The reason for this is that candlesticks show a lot more information that, say, a line chart would. Every single candle gives you 4 pieces of information for each candle period. Namely, the opening, closing, high and low prices.
Because of this information on each candle, you can see many different patterns arise out of these candles that can be predictors of what is to come. As with most things in trading, nothing is guaranteed, but if you use these patterns in conjunction with other triggers they can really help you succeed in your trading.
These are some of the most important candle patterns:
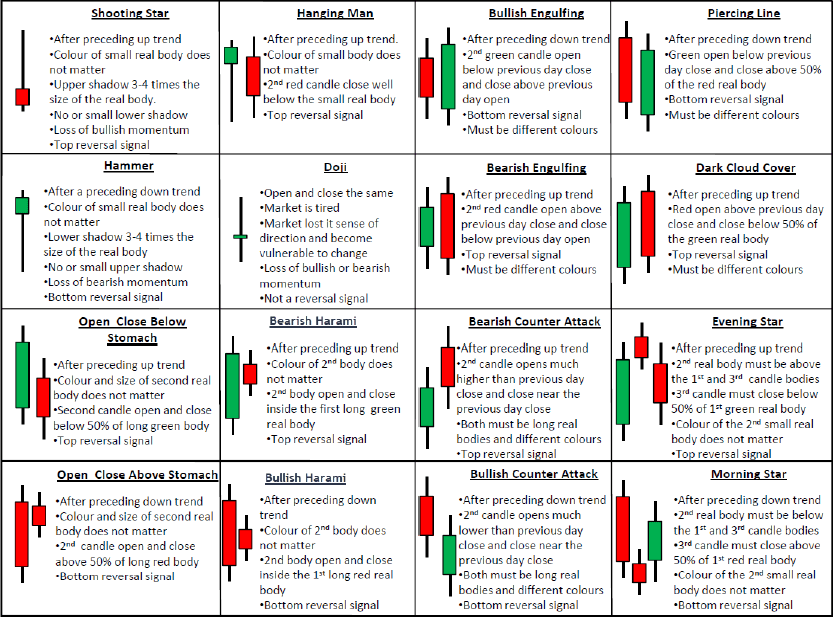
The more you spend practicing your trading and analyzing your charts, the easier it will become for you to recognize these patterns. And the more you see these pattern in your trading, you will see how significant they actually can be.
Please contact us if you have any problems with identifying or recognizing these patterns on your charts.
