Now that you are able to navigate around the platform, I bet you are itching to get into the actual trading part of the equation?!
There are a few concepts that are important for all traders to grasp and a very important one, if not the most important one of all of these is the concept of Support and Resistance.
Support and Resistance is probably the most widely used concept in technical analysis. Using this concept is a great way to identify entry and exit points for your trades. They are like invisible lines that help traders understand how prices might move in the future.

If you look at the above diagram you can see that this represents an upward moving moving market. But the markets never move in a straight line. They tend to move more in a zig-zag fashion.
As you can see from the diagram, when the price rises and then retraces, the peak it reached before pulling back becomes resistance.
When the price starts rising again, the lowest point it hit before moving up becomes support.
Further down the line, these levels where it paused and changed direction can become significant areas where the price might act the same or in a similar way. This is why finding these levels can be a great tool in your trading.
Support is like a floor for the price. Imagine the price is falling, and when it reaches a certain level, it stops going lower, as if it’s bouncing off the floor. This level tends to be where buyers step in and start buying because they think the price is low enough to be a good deal. So, support is a price level that “supports” the price from going down further.
Resistance, on the other hand, is like a ceiling for the price. When the price is rising and hits a certain level, it often struggles to go higher, like it’s bumping into the ceiling. This is where sellers usually step in because they think the price is too high and might fall. So, resistance is a price level that “resists” the price from going higher.
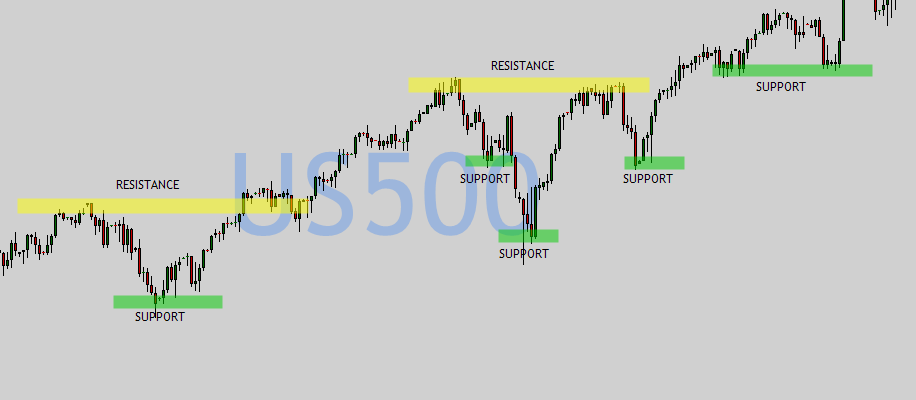
How to find entry and exit points using Support and Resistance
In the above image you can see different support and resistance areas drawn onto a chart.
When the price is near support, traders might think it’s a good time to buy, expecting the price to bounce back up. It’s like catching a falling object right before it hits the ground, hoping it’ll go up again.
On the other hand, when the price is near resistance, traders might think it’s a good time to sell or take profits, expecting the price to struggle or fall back down. It’s like selling something right before it gets too expensive, hoping to avoid the drop.
By watching how the price behaves around these levels, traders try to make decisions that have a higher chance of success, using support to enter buys and resistance to exit or short.
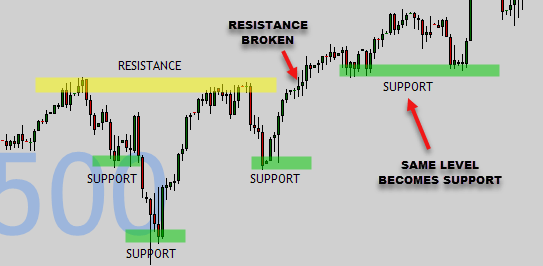
The price doesn’t always change direction at these levels, though. A lot of the time these levels are broken and the price continues in the same direction. When this happens, the level that was resistance often becomes support later on as the price go back down to bounce off of it again.
Homework: I would encourage you to open up some charts and try to recognize these different support and resistance levels and see how the price reacts at these levels.
As always, contact us should you have any questions.
