Welcome back to our series on technical indicators! In our previous posts, we explored the basics of the Stochastic and the Average True Range (ATR) indicator. Today, we’re delving into another powerful tool in the trader’s arsenal: the Moving Average Convergence Divergence (MACD) indicator.
Understanding the MACD Indicator
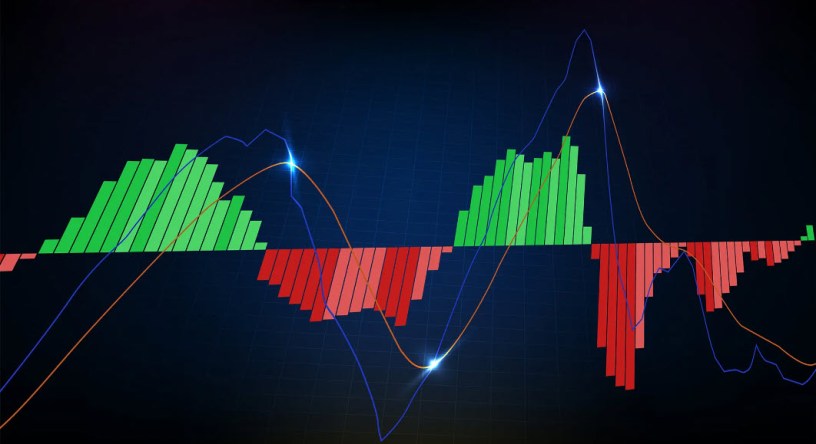
The MACD indicator is a popular momentum oscillator that helps traders identify trend direction, momentum strength, and potential trend reversals. Developed by Gerald Appel, the MACD is composed of three main components:
- MACD Line (Blue Line): The MACD line is calculated by subtracting the 26-period Exponential Moving Average (EMA) from the 12-period EMA.
- Signal Line (Orange Line): The signal line is a 9-period EMA of the MACD line. It smooths out the MACD line and generates trading signals.
- Histogram: The histogram represents the difference between the MACD line and the signal line. It provides visual cues about the strength of momentum.
How Does the MACD Work?
The MACD indicator is primarily used to identify bullish and bearish trends and potential trend reversals. Here’s a simplified explanation of how it works:
- Bullish Signal: When the MACD line crosses above the signal line, it generates a bullish signal, indicating potential upward momentum in the price.
- Bearish Signal: Conversely, when the MACD line crosses below the signal line, it generates a bearish signal, suggesting potential downward momentum in the price.
- Divergence: Divergence occurs when the price of the asset moves in the opposite direction of the MACD indicator. Bullish divergence occurs when the price makes lower lows while the MACD indicator forms higher lows, signaling potential upward reversal. Conversely, bearish divergence occurs when the price makes higher highs while the MACD indicator forms lower highs, indicating potential downward reversal.
Practical Application of the MACD Indicator
Now that we understand the components of the MACD indicator, let’s explore how traders can use it in their trading strategies:
- Trend Identification: Traders can use the MACD to identify the direction of the prevailing trend. A rising MACD indicates bullish momentum, while a falling MACD suggests bearish momentum.
- Signal Confirmation: Traders can use the MACD signal line crossover as confirmation of a potential trend reversal. However, it’s essential to consider other technical indicators and price action to validate signals effectively.
- Divergence Trading: Divergence between the MACD indicator and price action can signal potential trend reversals. Traders can use divergence as a contrarian indicator to anticipate changes in market direction.
Conclusion
The Moving Average Convergence Divergence (MACD) indicator is a valuable tool for traders seeking to identify trends, momentum, and potential trend reversals in the market. By understanding its components and how to interpret signals, traders can make more informed decisions and enhance their trading strategies.
In our next post, we’ll explore another essential technical indicator, so stay tuned for more insights into the world of trading!
At Sure Trading we use the MACD in one of our tried and tested trading strategies. To join our vibrant trading community, visit our website on http://www.suretrading.co.za
