Welcome to the world of technical analysis! In this series of blog posts, we’ll explore various technical indicators that traders use to make informed decisions in the financial markets. To kick things off, let’s delve into the Stochastic Indicator, a powerful tool that helps traders identify potential trend reversals and market turning points.
Understanding the Stochastic Indicator:
- What is the Stochastic Indicator? The Stochastic Indicator is a momentum oscillator that compares a particular closing price of a security to a range of its prices over a certain period. Developed by George C. Lane in the late 1950s, it aims to highlight overbought or oversold conditions in a market, indicating potential reversal points.
- Components of the Stochastic Indicator:
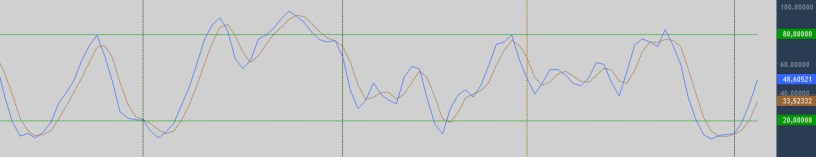
- %K Line: Represents the current close relative to the high-low range.
- %D Line: A smoothed average of %K, often referred to as the signal line.
- Understanding Overbought and Oversold Conditions:
- Overbought: When the Stochastic Indicator exceeds 80, suggesting that the market may be overextended, and a potential reversal to the downside could occur.
- Oversold: When the indicator falls below 20, indicating that the market may be oversold, and a potential reversal to the upside could happen.
- Stochastic Indicator Signals:
- Crossovers: Buy signals occur when the %K line crosses above the %D line, suggesting upward momentum. Conversely, sell signals occur when the %K line crosses below the %D line, indicating potential downward momentum.
- Divergence:
- Bullish Divergence: Occurs when the price makes lower lows, but the Stochastic Indicator forms higher lows, signaling a potential bullish reversal.
- Bearish Divergence: Occurs when the price makes higher highs, but the Stochastic Indicator forms lower highs, indicating a potential bearish reversal.
How to Use the Stochastic Indicator in Trading:
- Confirming Trends:
- Use the Stochastic Indicator to confirm the strength of a trend. In a strong uptrend, look for overbought conditions as potential profit-taking opportunities.
- Identifying Reversal Points:
- Look for divergence and crossovers to identify potential reversal points in the market.
- Risk Management:
- Combine the Stochastic Indicator with other tools to enhance risk management and make well-informed trading decisions.
The Stochastic Indicator is a valuable tool in a trader’s arsenal, providing insights into potential market reversals and helping to identify overbought or oversold conditions. In the upcoming posts in this series, we’ll explore additional technical indicators and how to integrate them into your trading strategy. Stay tuned for more insights into the fascinating world of technical analysis!
At Sure Trading, we use the stochastic indicator in our tried and tested trading strategies. Join our trading community today and we will teach you these strategies – http://www.suretrading.co.za
